01. Friends: who hangs out with whom?
Try it
Open: friends.html friends.svg
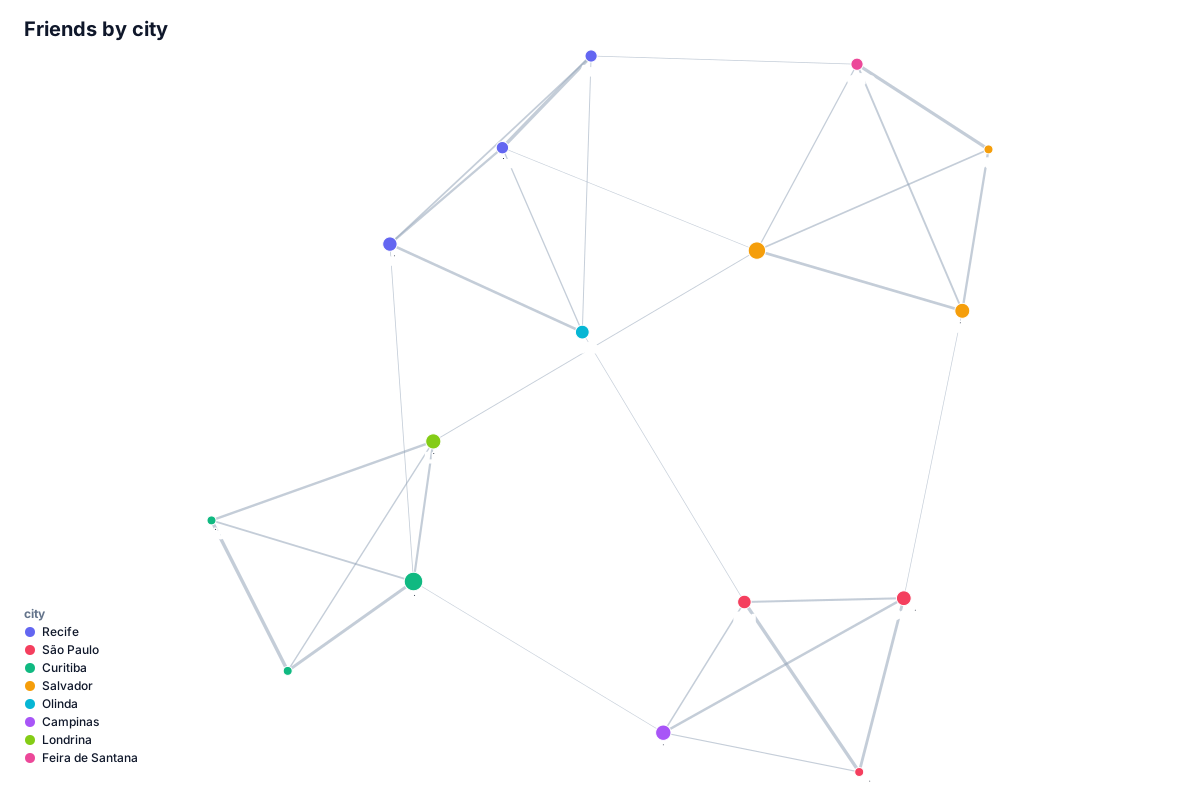
The simplest recipe. Start here.
The question: in a circle of 16 friends, which little groups exist, who bridges them, and who should meet?
The data
Two CSV files that ship in the examples/ folder.
friends.csv: one row per friendship.
| from | to | messages |
|---|---|---|
| Ana | Bia | 42 |
| Ana | Caio | 18 |
people.csv: one row per person (optional, but it is what makes the results
interesting).
| name | city | age |
|---|---|---|
| Ana | Recife | 31 |
| Bia | Recife | 28 |
That's all. The first table says who is linked to whom; the second says who everyone is.
Run it
From the tareco folder:
python examples/recipes/01-friends/friends.py
Step by step
1. Load. tareco recognizes the from and to columns on its own, and
messages, the only number column, becomes the strength of each friendship
(the weight).
g = tareco.Graph("friends.csv", nodes="people.csv")
print(g)
<Graph undirected, 16 nodes, 31 edges>
16 people (nodes) and 31 friendships (edges). Undirected means the link goes both ways, as friendship does.
2. What it shows, in words. explain() tells you what the network shows,
without you having to know the name of any algorithm:
What this network shows
- 16 nodes and 31 connections; on average each node connects to 3.9 others.
- Everything is connected in a single network.
- It forms 4 groups that mostly connect among themselves: 77% of the connections stay inside a group.
- Group 1 (4 nodes, 25%): city: Recife in 75% (vs 19% overall). Key members: Bia, Caio and Ana.
- Group 2 (4 nodes, 25%): city: São Paulo in 75% (vs 19% overall). Key members: Gabi, Fabi and Edu.
- ...
- Iris is a bridge between groups: it links Group 3, Group 2 and Group 1.
- The strongest connection is Ana and Bia (42).
Look at "city: Recife in 75% (vs 19% overall)": tareco read the people table and worked out on its own what sets each group apart.
3. Direct questions. Every question is a method:
g.communities()                 # the groups
g.shortest_path("Ana", "Otto")  # the shortest path
g.top_neighbors("Iris", n=3)    # who Iris talks to most
g.suggest_links(top=3)          # people with friends in common who have not met
Group 1: Ana, Bia, Caio, Duda
Group 2: Edu, Fabi, Gabi, Heitor
Group 3: Iris, João, Kaio, Lia
Group 4: Mel, Nina, Otto, Pedro
Path from Ana to Otto: ['Ana', 'Pedro', 'Otto']
Who Iris talks to most: [('João', 35), ('Lia', 24), ('Kaio', 19)]
Who should meet: [('Ana', 'Mel'), ('Bia', 'Pedro'), ('Ana', 'Edu')]
4. A portrait of each group. profile() gives the full card: traits, key
members, how much of the group's connections stay inside, and which group it
talks to most.
5. See it. g.save(...) writes an HTML page that opens in any browser
(g.show(...) opens it right away):
g.save("friends.html", color="city", size="betweenness", title="Friends by city")
color="city": one color per city.size="betweenness": whoever bridges the most is bigger. Iris and Mel stand out.
For a slide or an e-mail, the same call with .svg (or .png, with Pillow
installed) draws a still picture, laid out in Python:
g.save("friends.svg", color="city", size="betweenness", title="Friends by city")
What to look at in the page
- Hover a node: its neighbors light up.
- Click a node: a card opens with its metrics, attributes and neighbors.
- Insights button: the same sentences as
explain(). Click one to light up the nodes it talks about. - Shortest path button: click Ana, then Otto.
- Legend: click a city to hide it, double-click to see only that city.
With your own data
Any table with a "who" column and a "with whom" column works. If the columns have other names, say which:
g = tareco.Graph("my_table.csv", source="caller", target="callee")